
What is the Metaverse, Exactly, and How Will it Change Digital and Social Connection?
21st February 2022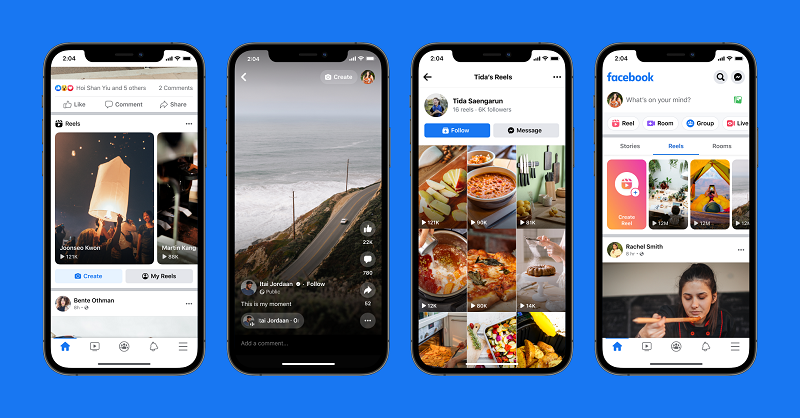
Meta Launches Facebook Reels to All Users, Expanding its Short-Form Video Push
23rd February 2022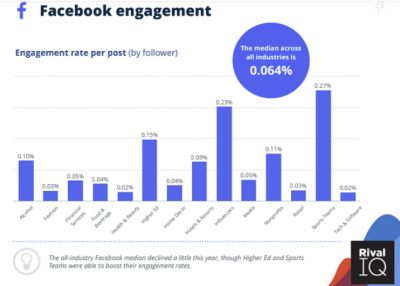
Borrowed from SocialMediaToday, written by Andrew Hutchinson
Ready for some sobering, though maybe comforting, stats on brand social media engagement?
Rival IQ has published its latest social media benchmarks report, which looks at the average brand engagement rates, by vertical, across each of the big social networks.
Though the actual measures here are important – in order to gauge brand social media performance, Rival IQ selected 150 companies at random from each industry based on its database of over 200,000 brands.
As explained by Rival IQ:
“Companies selected had active presences on Facebook, Instagram, and Twitter as of January 2021, and had Facebook fan counts between 25,000 and 1,000,000 and minimum Instagram and Twitter followers of 5,000 as of the same date.”
So it’s bigger brands we’re looking at here, with smaller SMBs likely seeing higher engagement among their more limited communities. But still, that’s a large sample size for each vertical, which should provide an indicative measure of what brands are seeing, in terms of overall social media user response.
Also, to clarify, Rival IQ’s engagement measures here are based on cumulative interactions on both organic and boosted social media posts, including likes, comments, favorites, retweets, shares and reactions. That combined interaction count is then divided by total follower count. So if your post has three comments, five likes and one share, your engagement would be nine, divided by your follower count.
It’s a fairly indicative measure, though it’s not weighted for certain metrics (i.e. some would consider a comment to be of more engagement value than a like).
So what are brands seeing, and how does your engagement rate measure up?
First off, on Facebook – according to Rival IQ’s findings, the average Facebook engagement rate across all verticals is a paltry 0.064%.

So the average brand is not even generating response from 1% of their audience with each post.
Of course, this isn’t reach, so it’s not to say that the same percentage of your audience is actually seeing your content. But very, very few Facebook users feel compelled to respond to such these days.
For comparison, in 2019 and 2020, Facebook engagement according to the same Rival IQ report, was 0.09%, before it dropped to 0.08% last year. So it’s been a steady decline for brand engagement, which has slid even further in this report.
Does that mean that you should change your Facebook approach? Maybe pay for more ads to get more reach (note that ad engagement included in these numbers)?
Really, it’s hard to say, as these are overall numbers based on a large dataset, and individual results will vary. Facebook is also the most widely used social media app, even with its more recent decline in this front, so the reach potential alone will likely keep brands posting regardless. But if you have seen a drop-off of late, you’re not alone.
In terms of how often brands are posting to Facebook, the current average, overall, is 5.87 posts per week among the measured brands.

Though, as you can see, there are also some massive variances here.
Next up is Instagram, where average engagement has seen an even steeper decline, falling from 0.98% in 2021 to 0.67% in this new report.

Which, as any Instagram marketer can attest, is no real surprise.
Part of this is increased competition – as more brands chase audience trends, and try to tap into each platform on the rise, the competition for attention increases, which, in turn, leads to a decline in overall average engagement. In 2020, brand engagement on IG was at 1.22%, so it’s almost been cut in half in two years.
How do you get around that? The best tactic on Instagram seems to be posting video content, and using its latest new features, as that seems to work with the types of content that Instagram also wants to push. So if you have any good ideas for Reels, now may be the time to break them out.
According to Rival IQ’s data, brands are also posting to Instagram 4.55 times per week.

Note that this is feed posts, not Stories.
Finally, we have Twitter engagement, which has dipped from 0.045% in 2020, to 0.037% today.

Twitter engagement has never been super high, which makes sense given the faster-flowing tweet stream. As such, the latest numbers are not as dramatic as the changes on Facebook and Instagram, but brands, overall, are seeing less engagement per tweet.
That likely suggests that Twitter’s topics and audio Spaces haven’t done much for brands – though it could also suggest that marketers haven’t leaned into these newer elements too. Again, it’s hard to make definitive determinations based on generalized data, but overall, Twitter users were seemingly a little less interested what brands had to say over the last year.
Brands, on average, are tweeting five times per week.

There is still opportunity in each platform, but the numbers do suggest that most businesses are not tapping into such as yet.
The report really highlights the ever-changing social media landscape, and the need to be constantly refining your tactics in line with audience response. Newer tools should also be on your radar, as they generally reflect usage trends, and the more you’re able to lean into such, the better off you’ll be.
Rival IQ’s full report also includes industry-specific trend analysis for each platform, providing valuable insight for your planning. Or it might just give you some extra data to refer to when you’re trying to explain why your social media numbers are down of late.
You can download the full Social Media Benchmarks report for 2022 here.